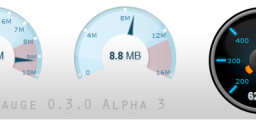
jGauge 0.3.0 Alpha 3 – Documentation
Please note this is an alpha release. Version 0.3.0 is still under development use with caution! 😉
If you find jGauge useful a link back to the home page jgauge.com or my blog dariancabot.com is appreciated.
See the main project page for more information and downloads.
Getting Started
Include these files in the head of your HTML:
<link rel="stylesheet" href="css/gauge_screen.css" type="text/css" />
<!--[if IE]><script type="text/javascript" language="javascript" src="js/excanvas.min.js"></script><![endif]-->
<script language="javascript" type="text/javascript" src="js/jquery-1.4.2.min.js"></script>
<script language="javascript" type="text/javascript" src="js/jQueryRotate.min.js"></script>
<script language="javascript" type="text/javascript" src="js/jgauge-0.3.0.a3.js"></script>
In the body of your HTML include a placeholder DIV:
<div id="jGaugeDemo" class="jgauge"></div>
Use JavaScript to create new jGauge instance and point it to our placeholder DIV.
Then use the jQuery ready() function to initialise the jGauge:
<script type="text/javascript">
        var myGauge = new jGauge(); // Create a new jGauge.
        myGauge.id = 'jGaugeDemo'; // Link the new jGauge to the placeholder DIV.

        // This function is called by jQuery once the page has finished loading.
        $(document).ready(function(){
                myGauge.init(); // Put the jGauge on the page by initialising it.
        });
</script>
We’re done! Now you can change the gauge value like this (obviously this works well with AJAX):
myGauge.setValue(7.35);
Parameters
This table lists all the available parameters to customise jGauge. When a new jGauge is created, the default values are used unless you override them with your own settings.
Please note: .gaugeId must be set and unique for each jGauge instance!
| Parameter | Default value | Description |
.id | '' (nothing) | The 'id' attribute of the placeholder DIV. Must be set and unique for each jGauge instance. | .segmentStart | -20 | Relative to 0° (pointing right / 3-o-clock). | .segmentEnd | 20 | Relative to 0° (pointing right / 3-o-clock). | .imagePath | 'img/jgauge_face_default.png' | Background image path. | .width | 160 | Total width of jGauge. | .height | 114 | Total height of jGauge. | .needle.imagePath | 'img/jgauge_needle_default.png' | Needle image path. | .needle.limitAction | limitAction.autoRange | What to do when the needle hits the limit. | .needle.xOffset | 0 | Shift needle position horizontally from center. | .needle.yOffset | 24 | Shift needle position vertically from center. | .label.xOffset | 0 | Shift value label position horizontally from center. | .label.yOffset | 20 | Shift value label position vertically from center. | .label.prefix | '' (nothing) | Prefix for the value label (i.e. '$'). | .label.suffix | '' (nothing) | Suffix for the value label (i.e. ' kW'). | .label.precision | 1 | Value label rounding decimal places. | .ticks.count | 11 | Number of tick marks around the gauge face. | .ticks.start | 0 | Value of the first tick mark. | .ticks.end | 10 | Value of the last tick mark. | .ticks.color | 'rgba(255, 255, 255, 1)' | Tick mark colour and alpha (opacity). | .ticks.thickness | 3 | Tick mark thickness. | .ticks.radius | 76 | Tick mark radius (distance from gauge center point). | .ticks.labelPrecision | 1 | Rounding decimal places for tick labels. | .ticks.labelRadius | 65 | Tick label radius (distance from gauge center point). | .range.radius | 55 | Range arc radius (distance from gauge center point). | .range.thickness | 36 | Range arc thickness (spread of the arc outwards). | .range.start | -24 | Range start point as an angle relative to 0deg (pointing right). | .range.end | 25 | Range end point as an angle relative to 0deg (pointing right). | .range.color | 'rgba(255, 32, 0, 0.2)' | Colour and alpha (opacity) of the range arc. |
Functions
This table lists the functions to use jGauge. The most important function is .init() which must be called on each new jGauge. Once this is done .setValue() can be used to change gauge value (this updates the value label and animates the needle).
| Function | Description | Example usage |
.init() | Initialises the gauge and puts it on the page. |
myGauge.init(); | .setValue() | Sets or updates the gauge value. |
myGauge.setValue(5.2); | .getValue() | Gets the current gauge value. |
var myValue = myGauge.getValue(); | .updateTicks() | Updates the tick marks and tick labels (call after changing tick parameters). |
// Make a change to the ticks. myGauge.tickCount = 6; // Now we must update ticks. myGauge.updateTicks(); | .updateRange() | Updates the range (call after changing range parameters). |
// Make a change to the range. myGauge.rangeStart = -20; // Now we must update range. myGauge.updateRange(); |

1 comment
[…] View the documentation page […]