Categories: Infrared thermometer
Tags: arduino development electronics hardware
Posted by: Darian Cabot
Comments:3
Infrared thermometer introduction
I’ve used an infrared thermometer at work for a while now and find it a great tool in many situations. However I felt that there is still room for improvement. I’d like to see better sampling modes, live trend graph, and even USB data logging. There are some tools that have some of these features, but they are quite expensive… and I’d like to build my own anyway so I can customise it to suit my requirements.
So another project was born, and first thing for me was to find a sensor module. 🙂
The infrared temperature sensor
The sensor module I’m using is from Freetronics, an Australian hobby electronics company that make lots of Arduino compatible modules. I bought mine from my local Jaycar store.
Product page:
The sensing area is a circle of 1:1 ratio with the distance. For example if I measured the surface of a wall 1m in front of me, the measurement area would be a 1m diameter circle. I would’ve preferred a narrower measurement area, but this is still ok so I’ll work with what is available.


Troubleshooting
Unfortunately the particular module I purchased wasn’t working for me out of the box. I wasn’t sure if I was doing something wrong, so I hooked up my DSO (digital storage oscilloscope) for a closer look:
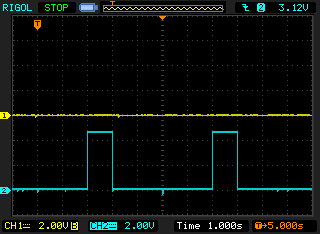
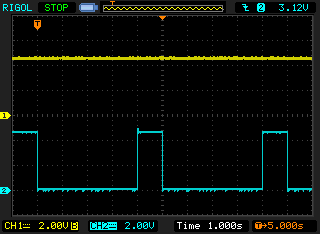
This is a very simple serial signal consisting of a data line and clock line. You can see from the DSO captures above neither are doing anything despite the acquire line being driven from the Arduino to request data. I contacted Freetronics and they suggested I may have a faulty module and they will replace it for me.
Luckily the next module worked perfectly! 🙂
The first prototype
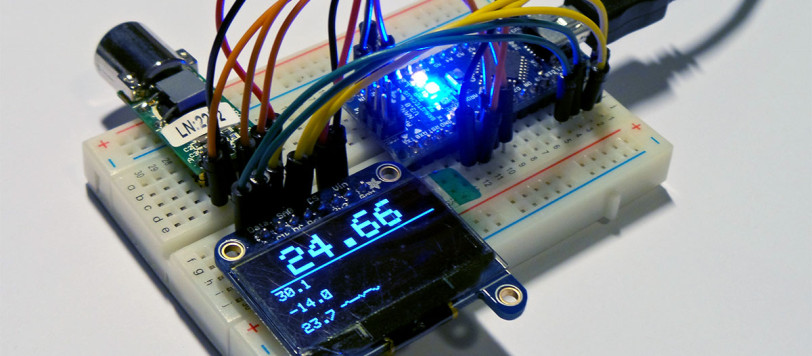
I quickly built up the first prototype using an Arduino Nano and a monochrome OLED display from Adafruit. Here it is on a breadboard:
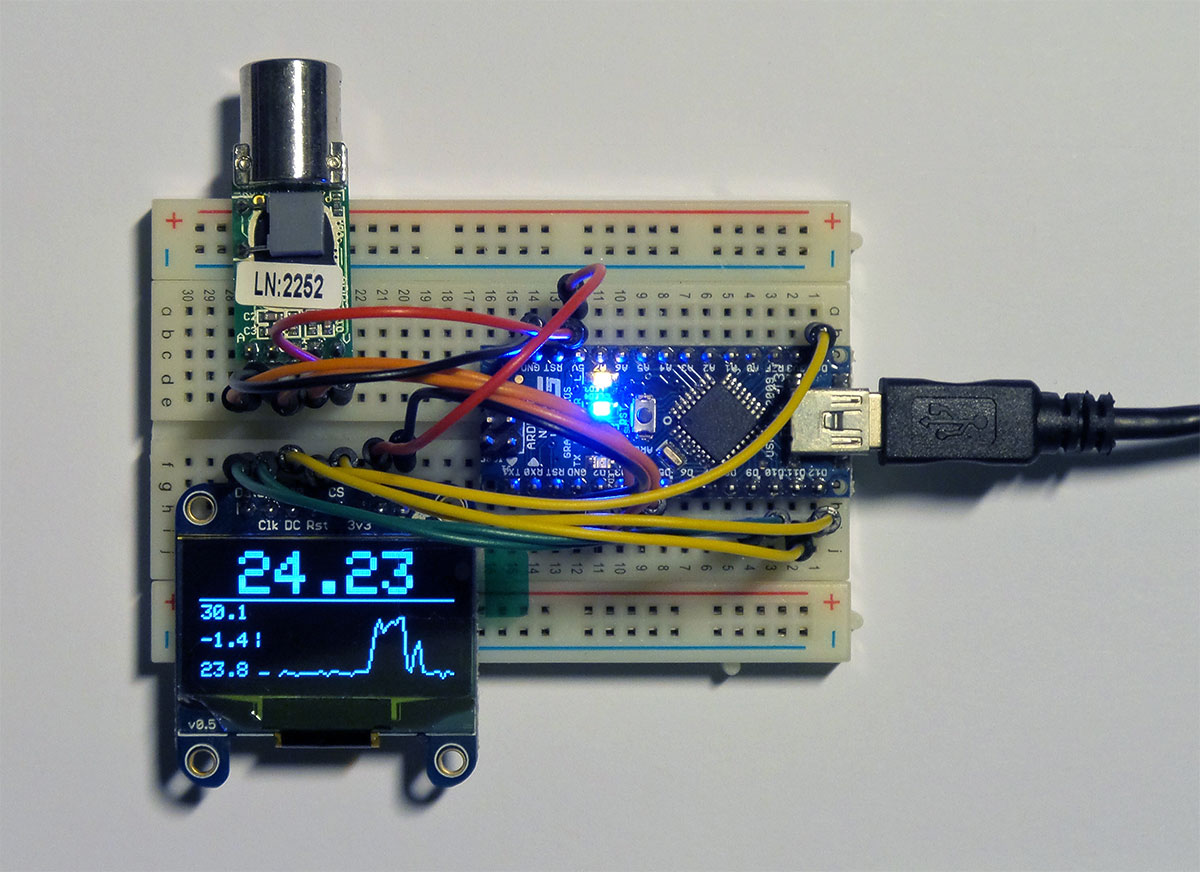
Here’s a closer look at the infrared thermometer module:

This is running the first version of my software which has a few bugs, and is a work in progress. The large number is the current measurement with a live trend graph underneath. One bug that is visible in the photos is the incorrect rolling-average / smoothing value shown in small text in the middle of the graph axis (the other two values are the graph minimum and maximum range).
Source code on GitHub: https://github.com/dariancabot/InfraredThermometer
I plan to bug fix this software and add more features like sample memory and other view modes. I also have a compact enclosure I’d like to use which I will detail in a future blog post.
Hardware and software engineer with experience in product development and building automation. Director at Cabot Technologies and Product Manager at NEX Data Management Systems.
3 comments
Hi Darian,
your work is quite a while back but maybe I’m lucky. Do you still have the code of the project above? Your set-up is exactly what I’m working with and I really like the graph that you’re plotting!
thanks a lot, michael
Hi Darian! Pretty project! it is possible to know the code
Hello Darian, this project is exactly what I was trying to achieve, I love the idea of the live graph on the display.
Would you mind sharing the code and diagrams ?